UrbanKisaanEnquire now

HomeIntelligenceFarmOS

See every plant as it grows.

FarmOS collects readings from sensors, cameras and scales on every plant, and shows you which treatment is working while the trial is still running.

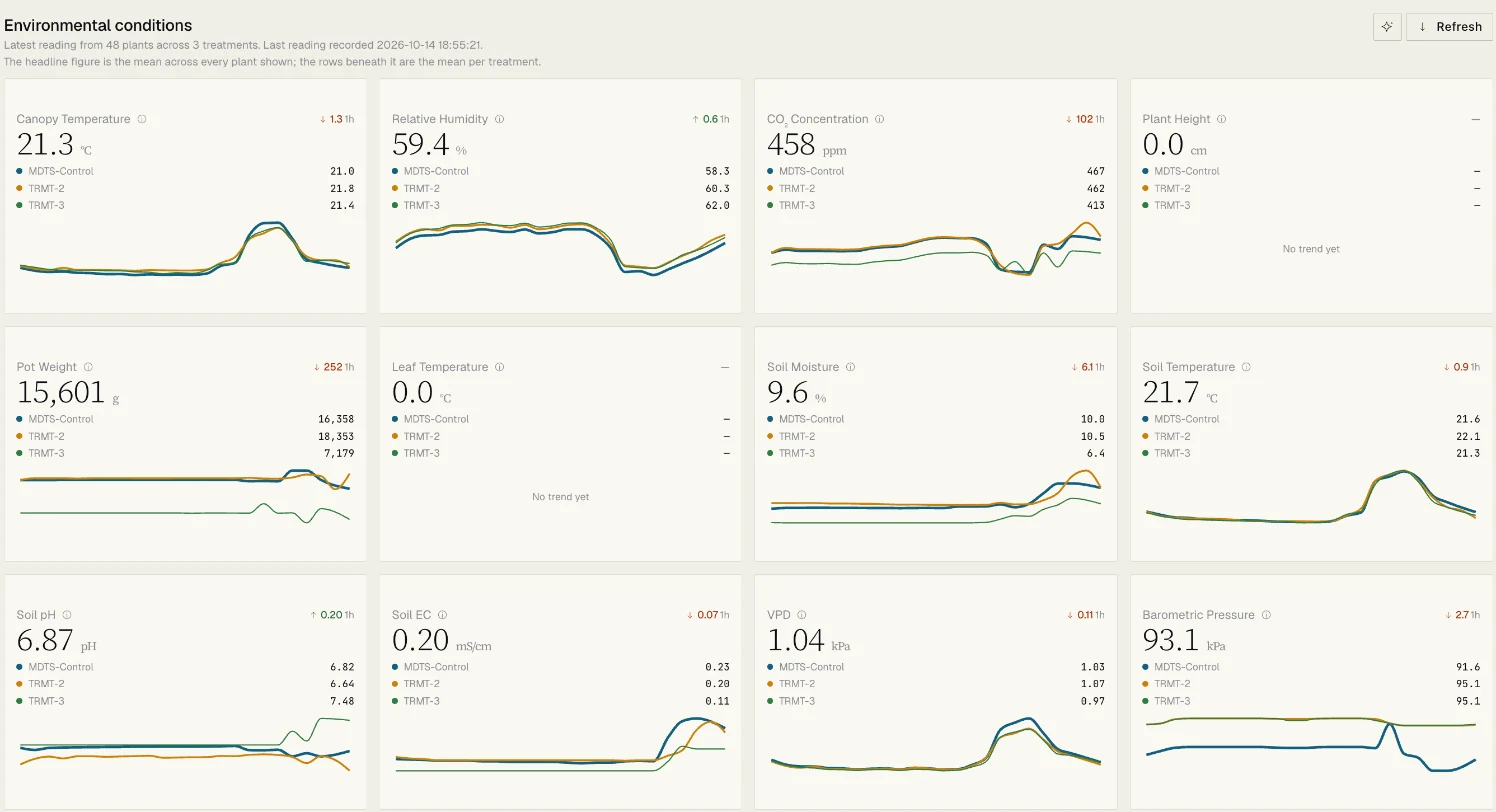
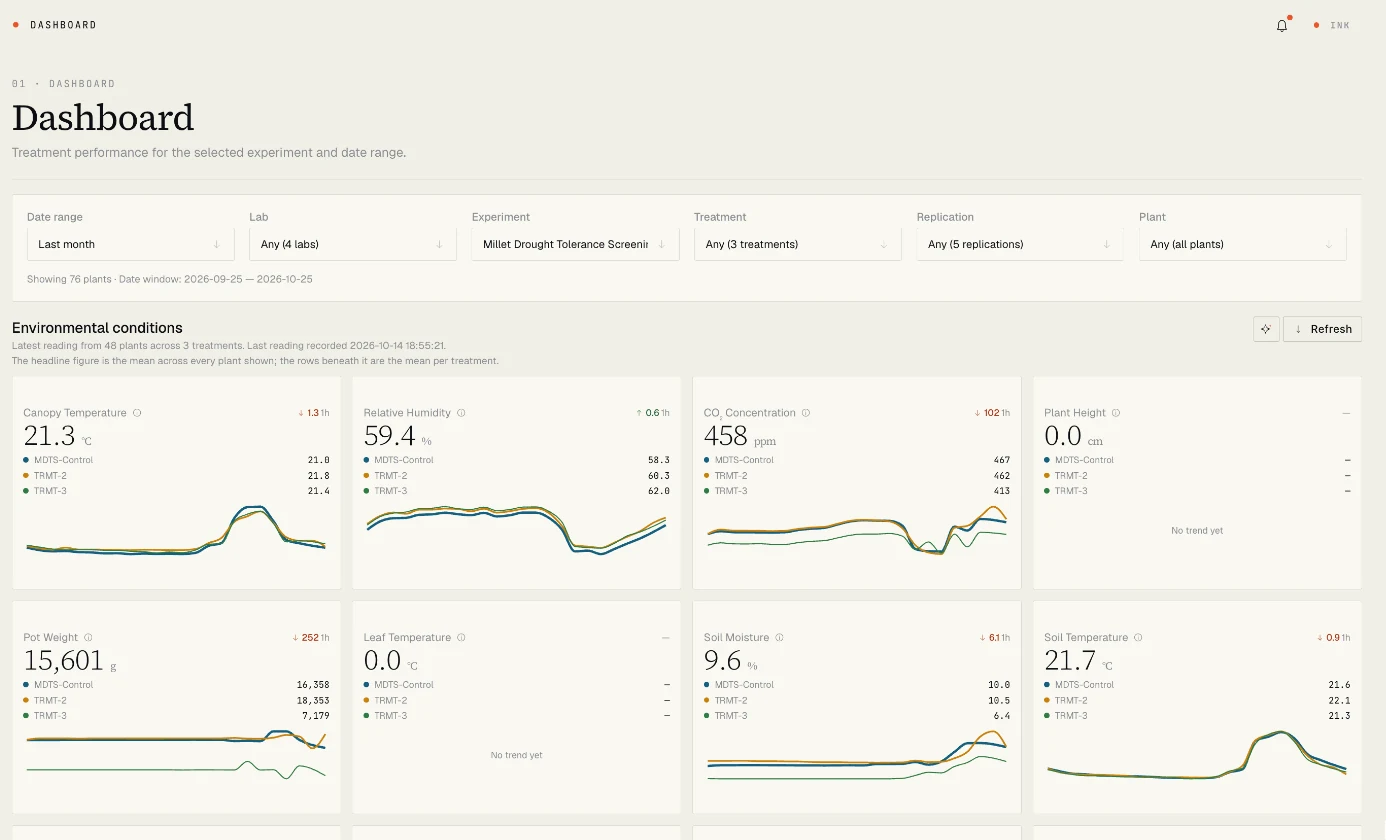
FarmOS dashboard showing a millet drought trial over the last month: filters for lab, experiment, treatment and plant, and cards for canopy temperature, humidity, CO2, pot weight, soil moisture and soil temperature, each split by treatment
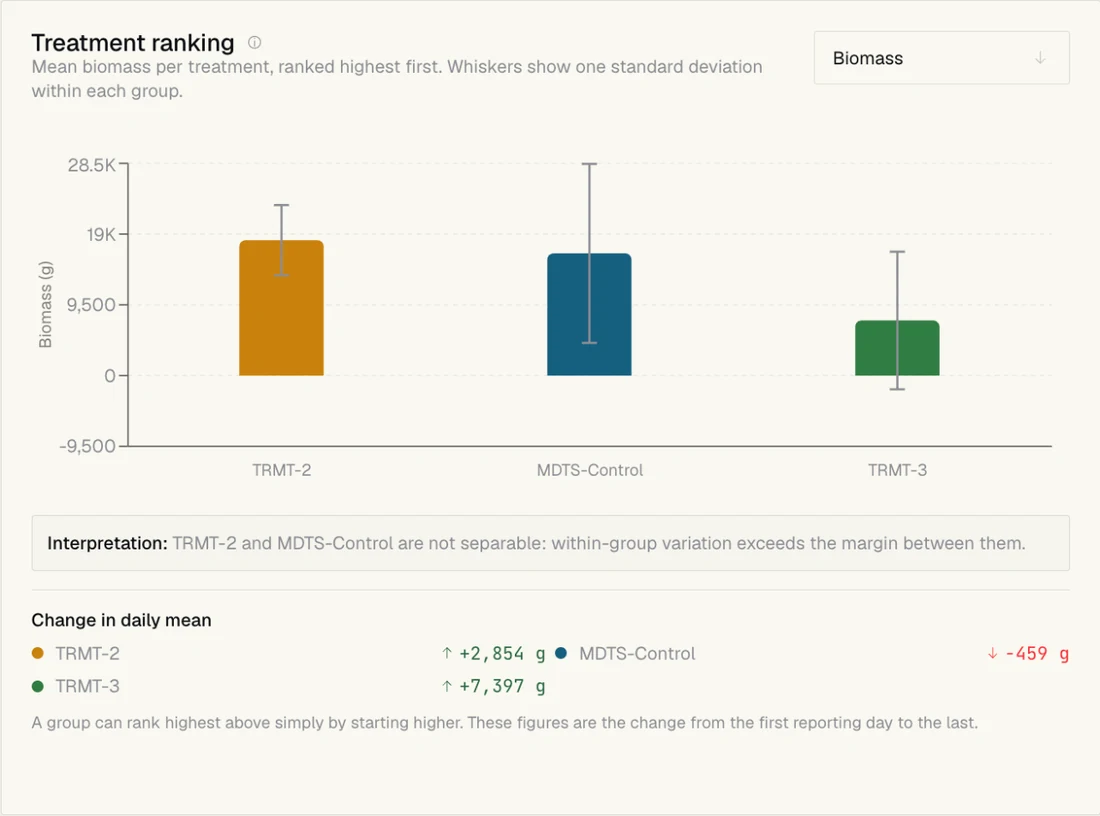
Treatment ranking chart: mean biomass for each treatment with spread bars and a plain-language interpretation
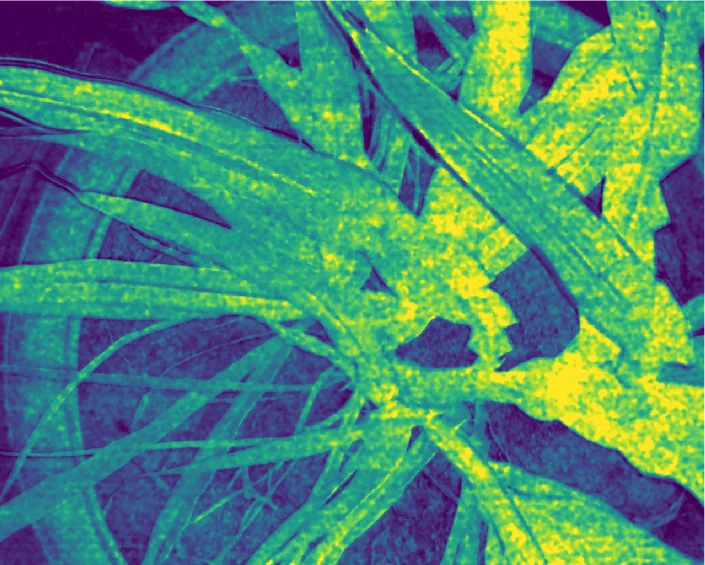
Chlorophyll index map of millet leaves, bright where the plant is greenest
CIG · greenness map
12readings per plant, from air to soil
25spectral indices from every plant image
3Dscan of each plant's height and spread
128kreadings logged in 13 days at ICAR-IIMR

What it measures

Four kinds of data, for every single plant.

Every plant gets the same conditions, so the differences you see come from the plant, not the weather.

Environment

The air and soil around each plant

Canopy temperature, humidity, CO₂, soil moisture, soil temperature, pH, EC, VPD and air pressure. Each reading is split by treatment, so you can check conditions stayed equal.

  • 12 readings
  • Split by treatment
  • Live trend lines
Grid of twelve environment cards with values and trend lines for each treatment

Shape

Every leaf, counted and measured

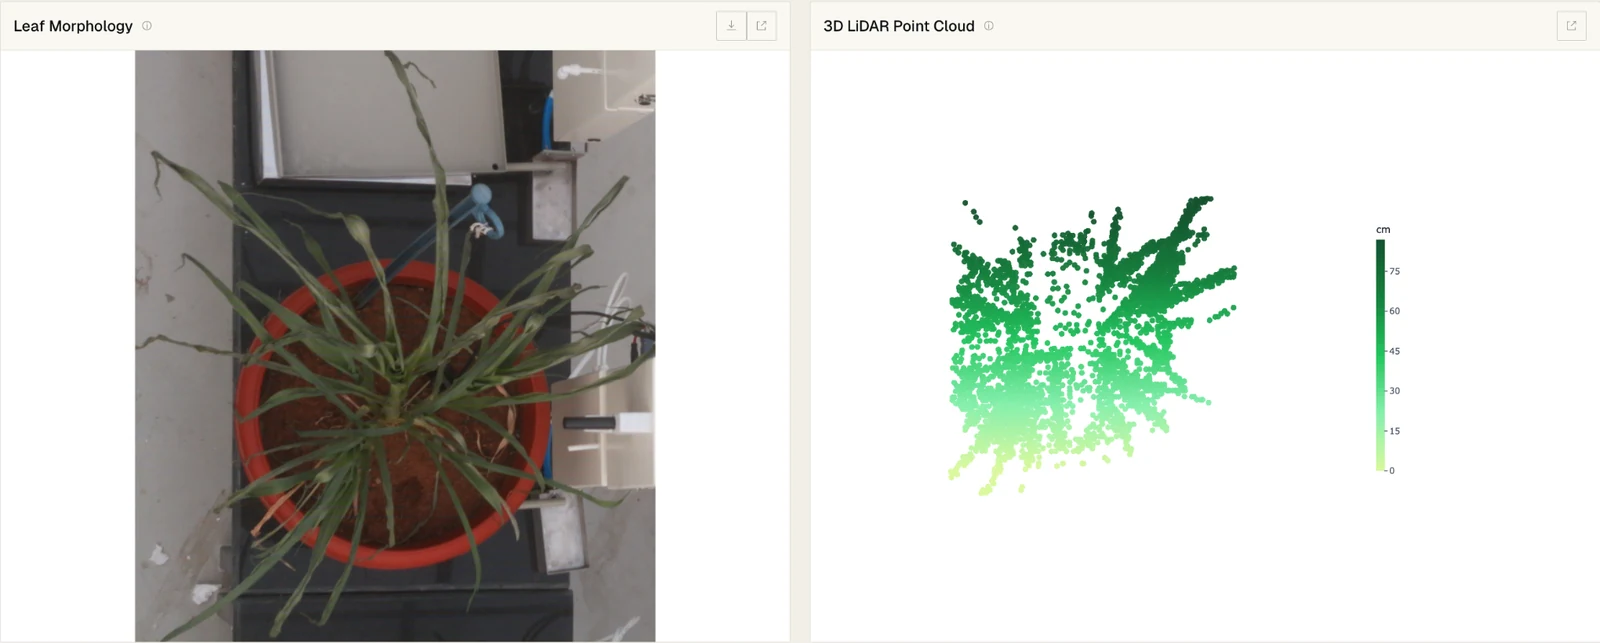
A top camera finds each leaf and measures its length, width and area. A 3D LiDAR scan maps the plant's height and spread.

  • Leaf count
  • Length and width
  • Leaf area
  • 3D canopy
Top-down photo of a millet plant beside its 3D LiDAR point cloud

Colour

Stress shows up before you can see it

Spectral cameras turn each photo into 25 indices in five groups: greenness, water, nitrogen and chlorophyll, drought and stress, and more.

  • 25 indices
  • 5 groups
  • Pixel-level maps
Chlorophyll index map
CIG
Enhanced vegetation index map
EVI
Green NDVI map
GNDVI

Weight

Growth, weighed every day

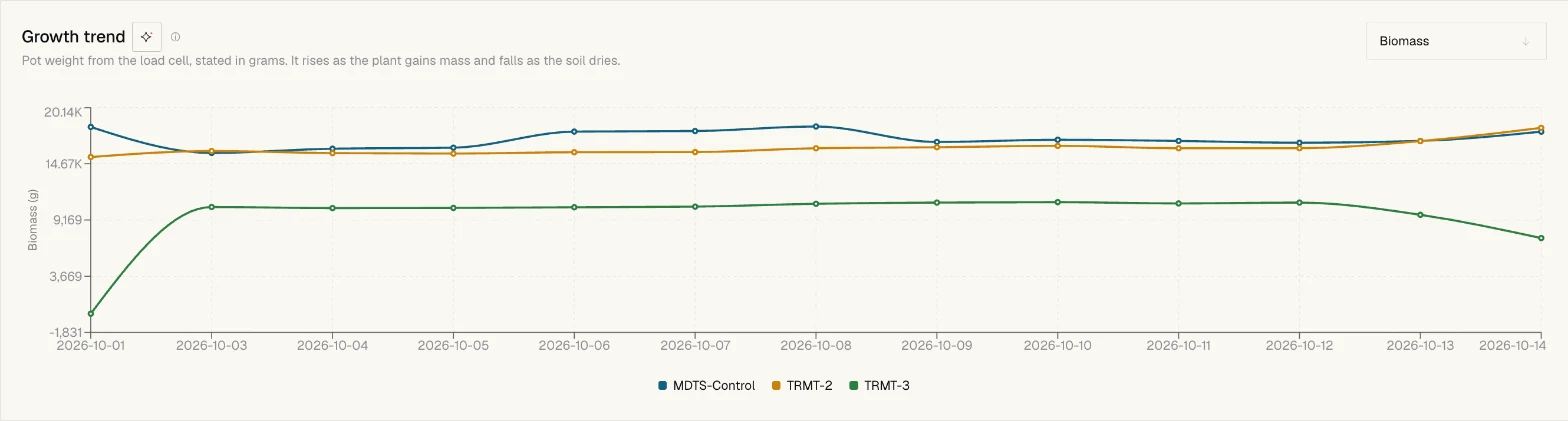
A scale under every pot logs weight as the plant gains mass and the soil dries, so the growth curve for each treatment builds itself.

  • Biomass
  • Growth trend
  • Daily range
Growth trend chart of biomass per treatment over two weeks

From data to decisions

Know which treatment is working, and how sure you can be.

FarmOS ranks treatments, shows every plant behind each average, and explains each chart in plain words.

  • Ranks every treatment

    By any trait, with the spread shown, so a lucky average cannot fool you.

  • Shows every plant

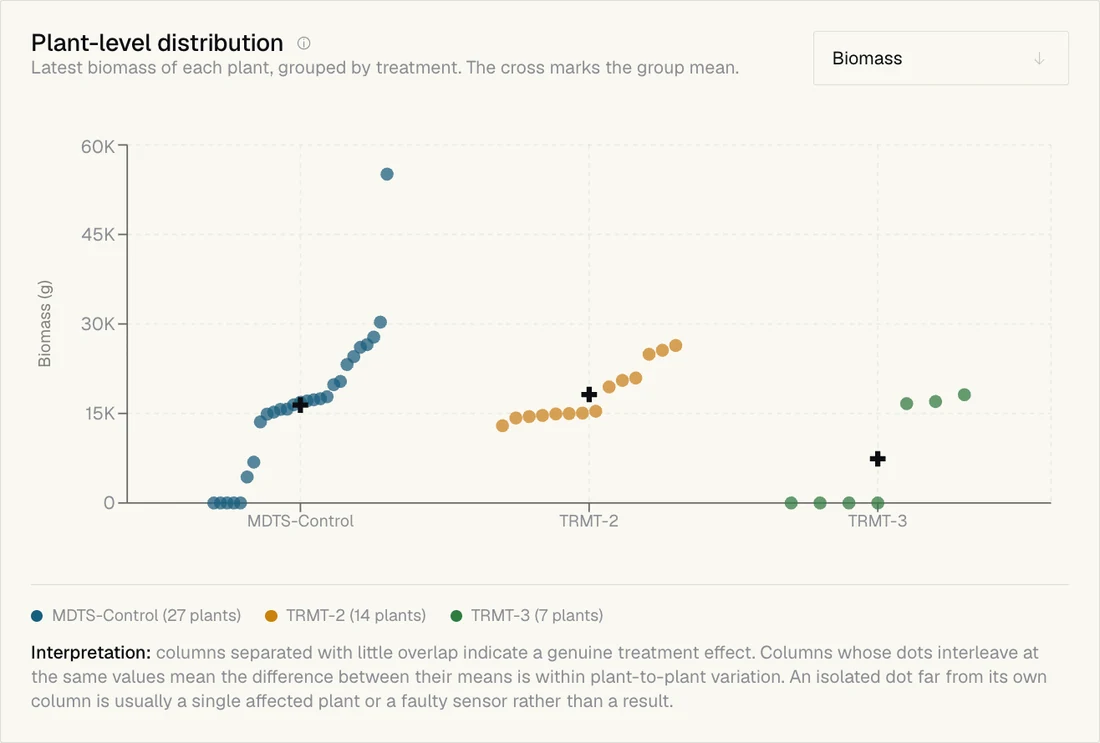
    One sick plant or faulty sensor stands out instead of hiding in an average.

  • Flags uneven groups

    Tells you when plants in a group disagree too much to compare yet.

  • Reads each chart for you

    A plain-language note under every chart says what the data does and does not show.

Treatment ranking: mean biomass per treatment with spread bars and an interpretation note
Treatment rankingBiomass · last month
Plant-level distribution: each plant's biomass as a dot, grouped by treatment, with the group mean marked
Every plant, not just the averageBiomass · by treatment
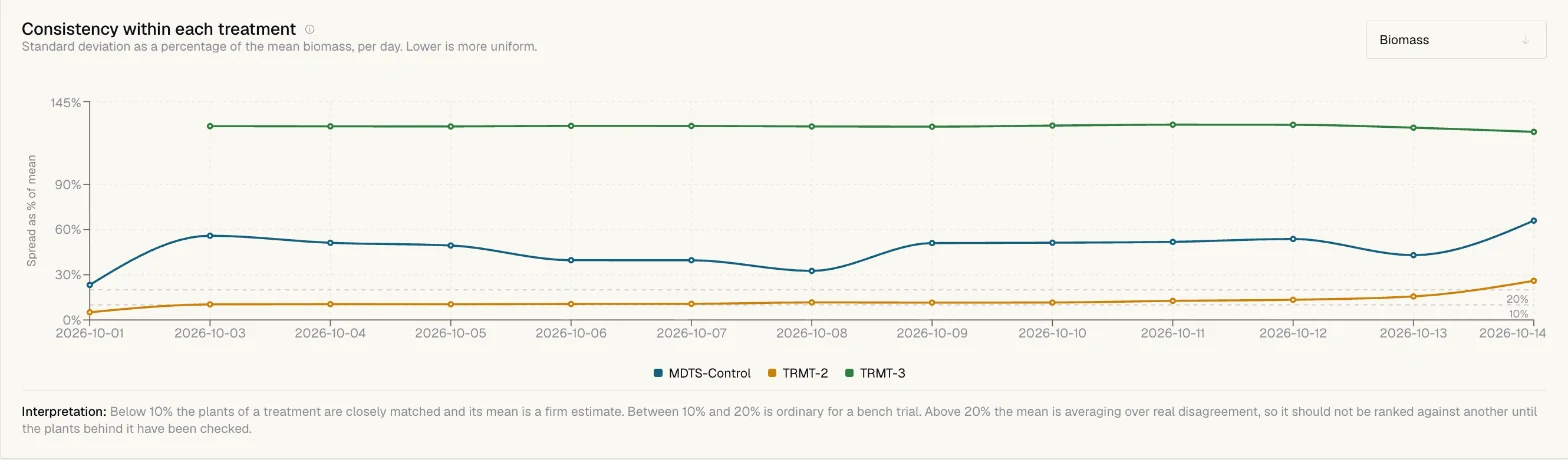
Consistency chart: spread within each treatment over time, with guide lines at 10% and 20%
Consistency within each treatmentLower is more uniform

In use · ICAR-IIMR, Hyderabad

Running trials at India's national millet research institute.

300plants tracked
4labs
6experiments
16treatments

One of those trials is a millet drought screen: 76 plants, 3 treatments and 5 replications, with 4 generations grown in a year.

See the results

Built for your team

Everything a research team needs, in one place.

Scientists, technicians and managers each get the view they need, from one plant to the whole experiment.

Dashboard

Every trial at a glance, filtered by date, lab, experiment, treatment or plant.

Analytics

Drill into one plant, one treatment or a whole experiment.

Compare

Put plants side by side across trends, shape and spectral data.

Reports and export

Build a report for any date range and export the data as CSV.

Team access

Add users and decide who sees and manages each lab and experiment.

Works with our rooms

Data flows in from the sensors in our GeneRush breeding rooms without manual entry.