UrbanKisaanEnquire now

HomeResearchAI and imaging

AI and imagingIEEE InGARSS 2025 · Dec 2025

Benchmarking three satellite time-series models for grape and strawberry classification in California

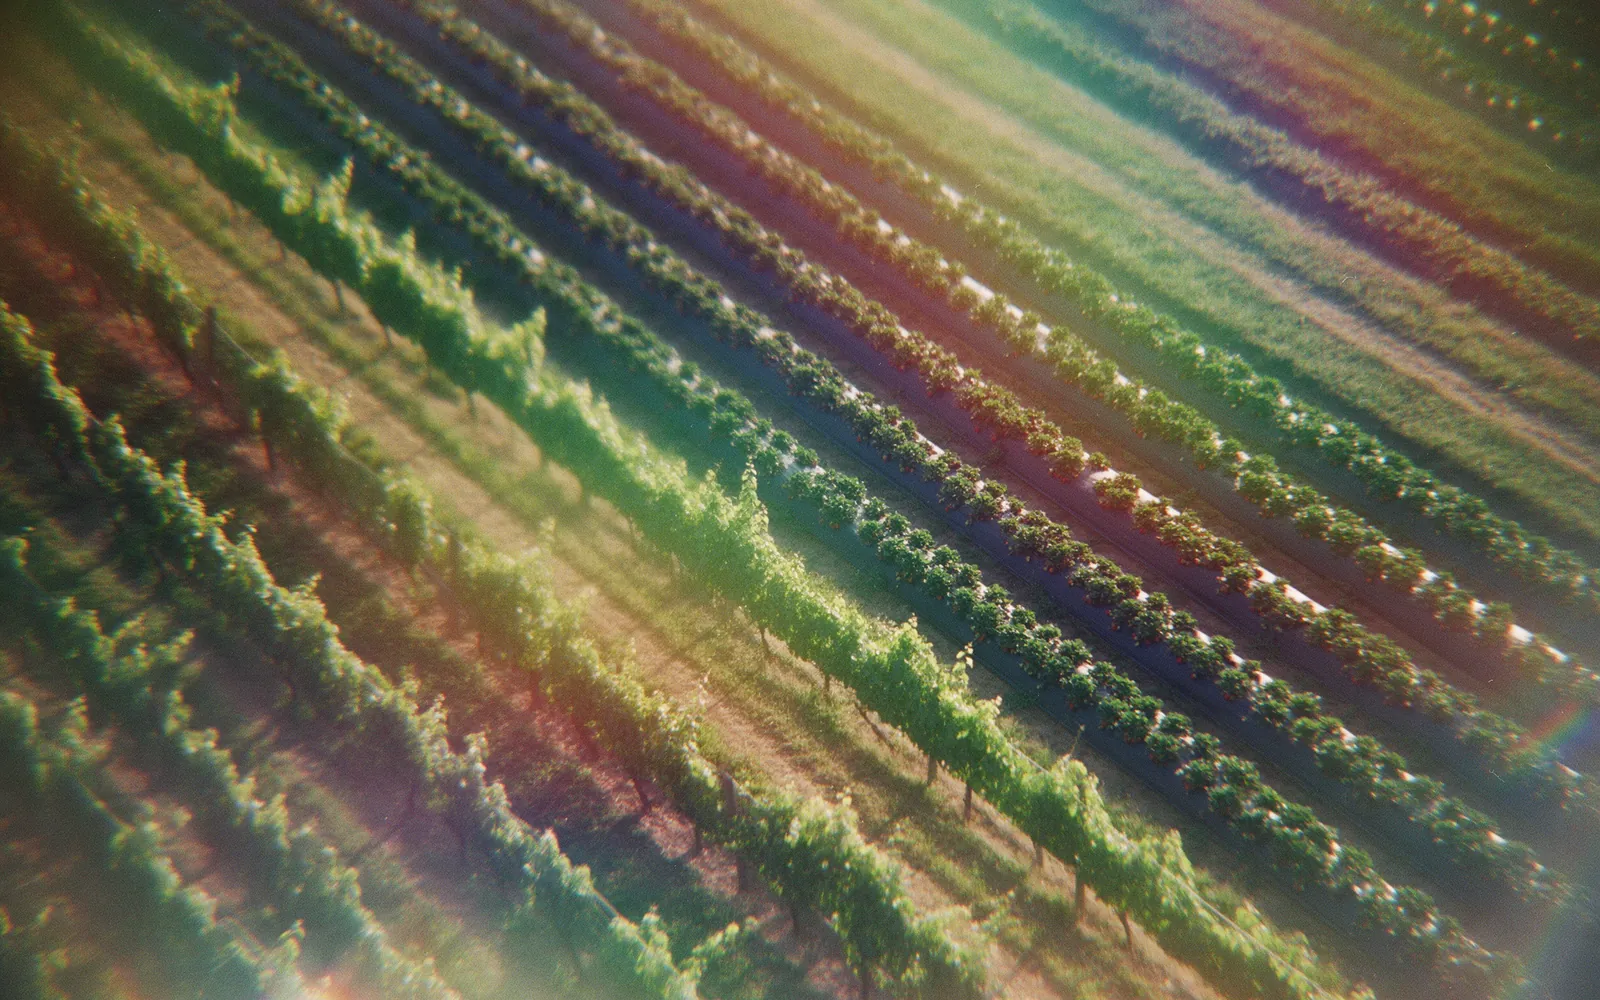
Telling one crop from another by satellite is the first step in mapping acreage, yield and risk. We tested three leading time-series models on grapes and strawberries in California, using Sentinel-2 images taken every few days across the season.

85.2%best accuracy on grapes (AR-STAR)
99.1%best accuracy on strawberries (PSE-LTAE)
40,000grape test samples, half grape and half other crops

Research question

Which satellite image time-series architecture best separates high-value horticultural crops?

Grapes and strawberries are high-value crops, but most satellite crop models are built and tested on wheat, maize and rice. It was not clear which modern model works best for specialty crops, or whether one model is enough.

Methods

CDL-labelled Sentinel-2 patches, 24 × 24 pixels × 10 bands across the season, with separate training and test regions

Three stages: label, cut, compare.

  1. LabelUse the USDA Cropland Data Layer to label grape fields, spot-checked on high-resolution imagery.
  2. CutTake 24 × 24 pixel patches in 10 colour bands, across many dates in the season.
  3. CompareTrain SITS-BERT++, PSE-LTAE and AR-STAR on the same regions and test on held-out regions.

Results

AR-STAR led on grapes (85.2% accuracy); PSE-LTAE led on strawberries (99.1%)

AR-STAR was best on grapes, with SITS-BERT++ close behind.

Figure 1

Accuracy by crop and model

Share of test samples classified correctly.

SITS-BERT++PSE-LTAEAR-STAR
Grapes
82.0%
64.6%
85.2%
Strawberries
91.4%
99.1%
97.5%
0%25%50%75%100%

Data: Tables II and III of the paper.

Results

F1 scores show the same crop-dependent ranking

PSE-LTAE was best on strawberries but weakest on grapes.

Figure 2

F1 score by crop and model

Balance of precision and recall. Higher is better.

SITS-BERT++PSE-LTAEAR-STAR
Grapes
0.82
0.63
0.85
Strawberries
0.91
0.99
0.98
00.250.50.751

Data: Tables II and III of the paper.

Implications

Model choice for operational crop mapping should be made per crop

The right model depends on the crop, so a mapping system should be able to switch models per crop. Satellite readings of each field also feed the environment inputs Jeeva uses to predict crop performance.

See Jeeva
85.2%best accuracy on grapes (AR-STAR)
99.1%best accuracy on strawberries (PSE-LTAE)
40,000grape test samples, half grape and half other crops

The paper

Benchmarking SITS-BERT++, PSE-LTAE, and AR-STAR Models for Crop Classification: A Case Study on Grapes and Strawberries in California

The full text, with methods and results, is on the publisher’s site.

Cite as
Shravan, G. S., Raj S, A., Kulvanth S, S., Vidyasager, G. R., Srisailam, S., Pankajakshan, P., Rajamani, K. T., & Bhaskaran, V. (2025). Benchmarking SITS-BERT++, PSE-LTAE, and AR-STAR models for crop classification: A case study on grapes and strawberries in California. IEEE India Geoscience and Remote Sensing Symposium (InGARSS). https://doi.org/10.1109/InGARSS67683.2025.11583883
Published in
IEEE India Geoscience and Remote Sensing Symposium (InGARSS), December 2025
Authors
Gade Sai Shravan, Ashrith Raj S, Sai Kulvanth S, Vidyasager G R, Swaroop Srisailam, Praveen Pankajakshan, Kumar T Rajamani, Bhaskaran V
Institutions
SSSIHL; Cropin AI Lab; UrbanKisaan AI Lab